Admissions Statistics
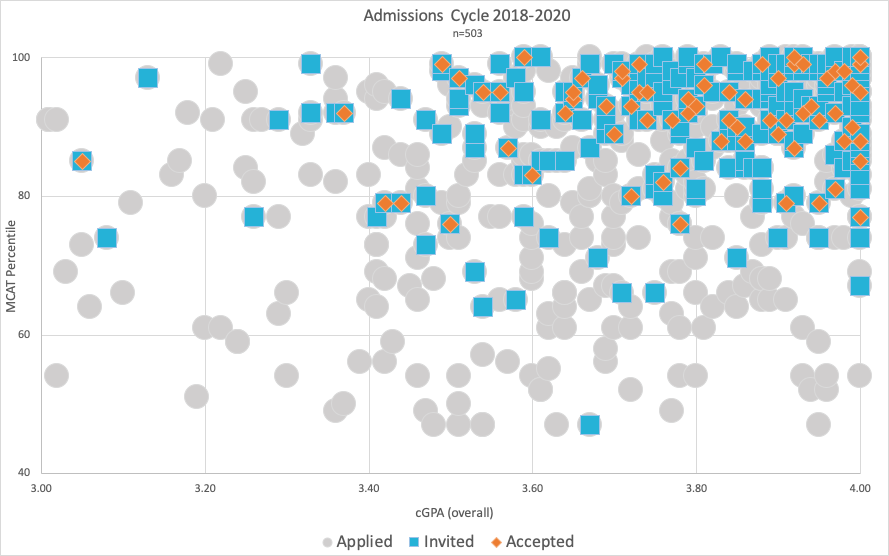
For transparency and equity, we are providing data below. This conveys data from 2018, 2019, and 2020 application cycle years, representing 503 out of a total 616 applications.
Please note that this visual conveys 81.7% (503/616) of our applications received and 100% of interviews and acceptances into our program. For visualization purposes, we removed applicants with both a GPA <3.0 and an MCAT below 40th percentile range.
With this data, we hope to visualize that although our median numbers are in the top right quartile (high MCAT, high GPA), this is not always the case. We have interviewed, accepted, and matriculated students who fall in lower ranges of MCAT scores and GPA as well.